The underwriting cycle in private health insurance refers to fluctuations in profit margin over time. This research, a novel effort, aims to understand the peak-to-trough magnitudes and determinants of the industry-wide underwriting cycle. Historical industry-wide profits and losses have not been previously estimated, making this study a significant contribution to the field. Based on the reports of the Centers for Medicare and Medicaid Services (national health expenditures reports), this study begins by constructing the underwriting cycle of private health insurance performance over the last six decades, from which profit margins can be estimated. Expressing the net cost of private health insurance and personal health expenditures as a fraction of the premium facilitates the analysis, which employs standard methods. The results show, over a 62-year period from 1960 through 2022, that there are 12 underwriting cycles. The capacity to generate profits is influenced by the cost of personal healthcare expenditures, competition for enrollment, and the availability of substitutes. Evidence of reduced capacity for profitability is a finding that additional enrollment does not contribute to profits and that private health insurance enrollment is generally declining. Cumulative profits due to the sales of private health insurance only over the 62 years assessed are negative.
| Published in | International Journal of Health Economics and Policy (Volume 9, Issue 3) |
| DOI | 10.11648/j.hep.20240903.12 |
| Page(s) | 71-79 |
| Creative Commons |
This is an Open Access article, distributed under the terms of the Creative Commons Attribution 4.0 International License (http://creativecommons.org/licenses/by/4.0/), which permits unrestricted use, distribution and reproduction in any medium or format, provided the original work is properly cited. |
| Copyright |
Copyright © The Author(s), 2024. Published by Science Publishing Group |
Underwriting Cycle, Profit, Loss, Private Health Insurance, Medicaid, Medicare, Price Elasticity of Demand
Year of peak | Year of trough | Number of Years | Change in profit margin |
|---|---|---|---|
peak to trough | peak to trough | ||
1960 | 1964 | 4 | -1.54% |
1966 | 1970 | 4 | -4.20% |
1972 | 1975 | 3 | -4.56% |
1978 | 1980 | 2 | -3.63% |
1984 | 1987 | 3 | -5.64% |
1990 | 1992 | 2 | -0.98% |
1993 | 1998 | 5 | -2.22% |
2003 | 2009 | 6 | -2.49% |
2010 | 2013 | 3 | -0.32% |
2014 | 2016 | 2 | -0.84% |
2018 | 2019 | 1 | -1.34% |
2020 | 2021 | 1 | -3.12% |
Method | |||||||
|---|---|---|---|---|---|---|---|
Hausman | linear regression | Paired t-test | |||||
Comparison | 2 | P-value | Adjusted R2 | RMSE | t | P (|T|>|t|) | Mean difference |
NHE v BCBS (n = 38) | 0.58 | 0.448 | 0.59 | 0.0098 | -0.199 | 0.847 | -0.0005 |
NHE v HMO (n = 16) | 0.00 | 0.952 | 0.33 | 0.0086 | -2.86 | 0.012 | -0.008 |
Independent variables | Dependent variables (enrollments) | ||
|---|---|---|---|
Coefficient label | PHI | Medicare | Medicaid |
PHI enrollment | -0.130† | 0.232† | |
Medicare enrollment* | -0.958† | 1.54††† | |
Medicaid enrollment* | 0.558† | 0.503††† | |
PHCE.** | -1.725††† | -0.371 | 1.16††† |
Cost of PHI** | -1.460 | -1.04 | 0.66 |
Intercept | 0.858††† | 0.194††† | 19.70 |
Independent variables | Coef. | t | p-value |
|---|---|---|---|
Medicare enrollment* | -0.304 | -2.03 | 0.051 |
Medicaid enrollment* | 0.149 | 1.74 | 0.092 |
PHI enrollment* | 0.010 | 0.19 | 0.850 |
Personal healthcare exp.† | -1.280 | -7.66 | 0.000 |
Cost of PHI† | 9.908 | 13.81 | 0.000 |
Intercept | 0.013 | 0.27 | -0.792 |
ATC | Average Total Cost |
BCBS | Blue Cross Blue Shield |
CMS | Center for Medicare and Medicaid Services |
HMO | Health Maintenance Organization |
NHE | National Health Expenditures |
PHI | Private Health Insurance |
PHE | Personal Healthcare Expenditures |
Nominal Dollars in Millions | ||||
Year | PHI profits | Average Total Cost | ||
1960 | $ | 126 | $ | 635 |
1961 | $ | 124 | $ | 707 |
1962 | $ | 126 | $ | 784 |
1963 | $ | 68 | $ | 870 |
1964 | $ | 37 | $ | 991 |
1965 | $ | 107 | $ | 1,102 |
1966 | $ | 159 | $ | 1,127 |
1967 | $ | 94 | $ | 1,144 |
1968 | $ | 164 | $ | 1,295 |
1969 | $ | (261) | $ | 1,468 |
1970 | $ | (427) | $ | 1,705 |
1971 | $ | (168) | $ | 1,960 |
1972 | $ | 372 | $ | 2,268 |
1973 | $ | 318 | $ | 2,522 |
1974 | $ | (534) | $ | 2,873 |
1975 | $ | (846) | $ | 3,371 |
1976 | $ | (289) | $ | 4,120 |
1977 | $ | 996 | $ | 5,014 |
1978 | $ | 1,274 | $ | 5,758 |
1979 | $ | 586 | $ | 6,695 |
1980 | $ | (802) | $ | 7,628 |
1981 | $ | (814) | $ | 9,012 |
1982 | $ | (377) | $ | 10,370 |
1983 | $ | 197 | $ | 11,562 |
1984 | $ | 3,154 | $ | 13,056 |
1985 | $ | 2,607 | $ | 14,429 |
1986 | $ | (656) | $ | 15,005 |
1987 | $ | (4,280) | $ | 16,488 |
1988 | $ | (2,999) | $ | 19,412 |
1989 | $ | (18) | $ | 22,598 |
1990 | $ | 4 | $ | 25,813 |
1991 | $ | (2,011) | $ | 28,218 |
1992 | $ | (2,679) | $ | 30,427 |
1993 | $ | 1,118 | $ | 32,662 |
1994 | $ | 143 | $ | 34,210 |
1995 | $ | (1,694) | $ | 36,084 |
1996 | $ | (1,802) | $ | 38,187 |
1997 | $ | (4,813) | $ | 40,047 |
1998 | $ | (6,929) | $ | 42,599 |
1999 | $ | (5,604) | $ | 46,087 |
2000 | $ | (4,423) | $ | 50,641 |
2001 | $ | (5,109) | $ | 55,536 |
2002 | $ | 3,021 | $ | 61,787 |
2003 | $ | 9,701 | $ | 67,766 |
2004 | $ | 8,463 | $ | 72,038 |
2005 | $ | 6,735 | $ | 77,256 |
2006 | $ | 5,922 | $ | 81,277 |
2007 | $ | 6,095 | $ | 86,259 |
2008 | $ | 1,394 | $ | 88,741 |
2009 | $ | (6,116) | $ | 91,674 |
2010 | $ | 143 | $ | 94,650 |
2011 | $ | 206 | $ | 98,257 |
2012 | $ | (2,022) | $ | 101,436 |
2013 | $ | (2,095) | $ | 101,608 |
2014 | $ | 782 | $ | 106,680 |
2015 | $ | (6,318) | $ | 112,974 |
2016 | $ | (7,120) | $ | 119,234 |
2017 | $ | (2,711) | $ | 125,093 |
2018 | $ | 8,563 | $ | 130,735 |
2019 | $ | (6,244) | $ | 133,974 |
2020 | $ | 16,751 | $ | 132,930 |
2021 | $ | (19,731) | $ | 141,364 |
2022 | $ | (18,429) | $ | 149,739 |
| [1] |
Walker, E. Health Insurers Post Record Profits. abcNEWS, February 12, 2010. Available at:
https://abcnews.go.com/Health/HealthCare/health-insurers-post-record-profits/story?id=9818699 Accessed January 15, 2019. |
| [2] |
Kapp, M. The Sick Business of Health-Care Profiteering. Vanity Fair, September 24, 2009. Available at:
https://www.vanityfair.com/news/2009/09/health-care200909 Accessed: January 15, 2019. |
| [3] |
Seelye, K. Q. Administration Rejects Health Insurer’s Defense of Huge Rate Increases. New York Times, February 11, 2010. Available at:
https://www.nytimes.com/2010/02/12/health/policy/12insure.html Accessed January 15, 2019. |
| [4] |
WELLPOINT, INC. ANNUAL REPORT PURSUANT TO SECTION 13 OR 15(d) OF THE SECURITIES EXCHANGE ACT OF 1934, For the fiscal year ended December 31, 2009, FORM 10-K. Available at:
https://www.sec.gov/Archives/edgar/data/1156039/000119312510034180/d10k.htm#toc91965_11 Accessed January 15, 2019. |
| [5] |
Humana Annual Report, 2017. Available at:
https://humana.gcs-web.com/static-files/c7a3ff1d-4a42-44b1-9284-342d4997366f Accessed February 26, 2019. |
| [6] |
Austin, D. A. and Hungerford, T. L. The Market Structure of the Health Insurance Industry. April 8, 2010. Congressional Research Service. Available at:
https://www.ncsl.org/documents/health/MrktStrOfHlthIns.pdf Accessed January 15, 2019. |
| [7] |
Houchens, PR, Clarkson, JA, and Melek, JP. Commercial health insurance: Overview of 2016 financial results and emerging enrollment and premium data. Milliman Research Report. May 2018. Available at:
http://www.milliman.com/insight/2018/Commercial-health-insurance-Overview-of-2016-financial-results-and-emerging-enrollment-and-premium-data/ Accessed: January 15, 2019. |
| [8] |
Getzen, T. E. Actuarial Projections of Health Care Costs: Accuracy, Bias and Asymptotes. American Society of Health Economists. July 6, 2011. Available at:
https://papers.ssrn.com/sol3/papers.cfm?abstract_id=1880486 Accessed January 15, 2019. |
| [9] |
Center for Medicare and Medicaid Services, Office of the Actuary. ACCURACY ANALYSIS OF THE SHORT-TERM (10-YEAR) NATIONAL HEALTH EXPENDITURE PROJECTIONS. Available at:
https://www.cms.gov/Research-Statistics-Data-and-Systems/Statistics-Trends-and-Reports/NationalHealthExpendData/downloads/ProjectionAccuracy.pdf Accessed January 30, 2019. |
| [10] | Judith Glazner, William R. Braithwaite, Steven Hull, and Dennis C. Lezotte. The Questionable Value of Medical Screening in the Small-Group Health Insurance Market. Health Affairs 1995 14: 2, 224-234. |
| [11] | Joy M. Grossman and Paul B. Ginsburg. As The Health Insurance Underwriting Cycle Turns: What Next? Health Affairs, 23:6, 91-102. November/December 2004. |
| [12] | Benjamin D. Sommers and others, “Insurance Churning Rates for Low-Income Adults Under Health Reform: Lower Than Expected but Still Harmful for Many,” Health Affairs 35 (10) (2016): 1816–1824, available at |
| [13] |
Bureau of Labor Statistics CPI inflation calculator. Available at:
https://data.bls.gov/cgi-bin/cpicalc.pl?cost1=4%2C878.00&year1=196001&year2=202212 Accessed July 17, 2024. |
| [14] |
Holzheu, Thomas and Finucane, James. Understanding the Current Underwriting Cycle—Difficult Times Extend Hard Market. Available at
https://www.soa.org/sections/reinsurance/reinsurance-newsletter/2021/august/rsn-2021-08-holzheu-finucane/ Accessed: July 17, 2024. |
| [15] | Fann, Greg. The ACA Underwriting Cycle. Health Watch. The Society of Actuaries, Health Section. October 2020. Available at: |
| [16] |
Center for Medicare and Medicaid Services, Office of the Actuary. National Health Expenditure Accounts: Methodology Paper, 2017 Definitions, Sources, and Methods. Available at:
https://www.cms.gov/Research-Statistics-Data-and-Systems/Statistics-Trends-and-Reports/NationalHealthExpendData/Downloads/DSM-17.pdf Accessed January 16, 2019. |
| [17] |
Center for Medicare and Medicaid Services, Office of the Actuary. Historical National Health Expenditure Data. Available at:
https://www.cms.gov/Research-Statistics-Data-and-Systems/Statistics-Trends-and-Reports/NationalHealthExpendData/NationalHealthAccountsHistorical.html Accessed November 27, 2018. |
| [18] | The American Hospital Association. Chart 1.29: Blue/BlueShield Underwriting Gain/Loss. Page 23, TrendWatch Chartbook 2003 Trends Affecting Hospitals and Health Systems July 2003 Prepared by The Lewin Group, Inc. for The American Hospital Association. |
| [19] | The American Hospital Association Chart 1.28: HMO Plan Median Operating Margins, 1990 – 2005. Page 22, TrendWatch Chartbook 2003 Trends Affecting Hospitals and Health Systems July 2003 Prepared by The Lewin Group, Inc. for The American Hospital Association. |
| [20] | Federal Reserve Economic Data Series A229RX0. Economic Research Division, Federal Reserve Bank of St. Louis. Available at: |
| [21] | Mankiw, N. G. Essentials of Economics, 6th edition. 2012 Cengage Learning. |
| [22] | Forecasting Health Insurer Profitability: 1999-2001. Milliman & Robertson, Inc. Radnor, PA. September 1999. |
| [23] |
Robin Rudowitz, Rachel Garfield, and Elizabeth Hinton. 10 Things to Know about Medicaid: Setting the Facts Straight. Updated March 2019: Issue Brief. Henry J. Kaiser Family Foundation. Available at:
https://digirepo.nlm.nih.gov/master/borndig/101740237/Issue-Brief-10-Things-to-Know-about-Medicaid-Setting-the-Facts-Straight.pdf Accessed 8/5/2024. |
APA Style
Cecil, W. T. (2024). The Private Health Insurance Underwriting Cycle, Economic Profits and Their Determinants. International Journal of Health Economics and Policy, 9(3), 71-79. https://doi.org/10.11648/j.hep.20240903.12
ACS Style
Cecil, W. T. The Private Health Insurance Underwriting Cycle, Economic Profits and Their Determinants. Int. J. Health Econ. Policy 2024, 9(3), 71-79. doi: 10.11648/j.hep.20240903.12
AMA Style
Cecil WT. The Private Health Insurance Underwriting Cycle, Economic Profits and Their Determinants. Int J Health Econ Policy. 2024;9(3):71-79. doi: 10.11648/j.hep.20240903.12
@article{10.11648/j.hep.20240903.12,
  author = {William Thomas Cecil},
  title = {The Private Health Insurance Underwriting Cycle, Economic Profits and Their Determinants
},
  journal = {International Journal of Health Economics and Policy},
  volume = {9},
  number = {3},
  pages = {71-79},
  doi = {10.11648/j.hep.20240903.12},
  url = {https://doi.org/10.11648/j.hep.20240903.12},
  eprint = {https://article.sciencepublishinggroup.com/pdf/10.11648.j.hep.20240903.12},
  abstract = {The underwriting cycle in private health insurance refers to fluctuations in profit margin over time. This research, a novel effort, aims to understand the peak-to-trough magnitudes and determinants of the industry-wide underwriting cycle. Historical industry-wide profits and losses have not been previously estimated, making this study a significant contribution to the field. Based on the reports of the Centers for Medicare and Medicaid Services (national health expenditures reports), this study begins by constructing the underwriting cycle of private health insurance performance over the last six decades, from which profit margins can be estimated. Expressing the net cost of private health insurance and personal health expenditures as a fraction of the premium facilitates the analysis, which employs standard methods. The results show, over a 62-year period from 1960 through 2022, that there are 12 underwriting cycles. The capacity to generate profits is influenced by the cost of personal healthcare expenditures, competition for enrollment, and the availability of substitutes. Evidence of reduced capacity for profitability is a finding that additional enrollment does not contribute to profits and that private health insurance enrollment is generally declining. Cumulative profits due to the sales of private health insurance only over the 62 years assessed are negative.
},
 year = {2024}
}
TY  - JOUR
T1  - The Private Health Insurance Underwriting Cycle, Economic Profits and Their Determinants

AU  - William Thomas Cecil
Y1  - 2024/09/11
PY  - 2024
N1  - https://doi.org/10.11648/j.hep.20240903.12
DO  - 10.11648/j.hep.20240903.12
T2  - International Journal of Health Economics and Policy
JF  - International Journal of Health Economics and Policy
JO  - International Journal of Health Economics and Policy
SP  - 71
EP  - 79
PB  - Science Publishing Group
SN  - 2578-9309
UR  - https://doi.org/10.11648/j.hep.20240903.12
AB  - The underwriting cycle in private health insurance refers to fluctuations in profit margin over time. This research, a novel effort, aims to understand the peak-to-trough magnitudes and determinants of the industry-wide underwriting cycle. Historical industry-wide profits and losses have not been previously estimated, making this study a significant contribution to the field. Based on the reports of the Centers for Medicare and Medicaid Services (national health expenditures reports), this study begins by constructing the underwriting cycle of private health insurance performance over the last six decades, from which profit margins can be estimated. Expressing the net cost of private health insurance and personal health expenditures as a fraction of the premium facilitates the analysis, which employs standard methods. The results show, over a 62-year period from 1960 through 2022, that there are 12 underwriting cycles. The capacity to generate profits is influenced by the cost of personal healthcare expenditures, competition for enrollment, and the availability of substitutes. Evidence of reduced capacity for profitability is a finding that additional enrollment does not contribute to profits and that private health insurance enrollment is generally declining. Cumulative profits due to the sales of private health insurance only over the 62 years assessed are negative.

VL  - 9
IS  - 3
ER  -
Independent Scholar, Knoxville, United States of America
Biography: William Thomas Cecil is an Independent Consultant. He completed his MBA in Finance at the University of Missouri at Kansas City in 1989. He studied economics at the University of Tennessee at Knoxville. He was the Director of Health Policy Research at BlueCross BlueShield of Tennessee from 2001-2009.
Research Fields: Healthcare quality, Risk-adjustment, Transmission of price effects, Healthcare Economics, and Healthcare econometrics.

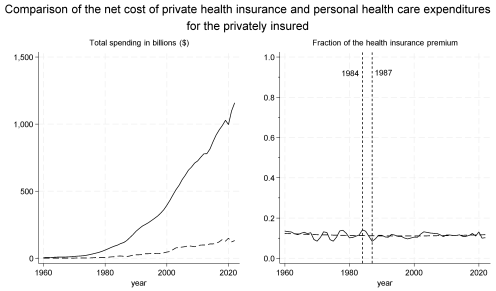
Figure 1. Left panel: The history of the net cost of health insurance (dashed) and personal health care expenditures (solid) in billions($) for those privately insured for 62 years, from 1960 through 2022. Right panel: A display of the same information expressed as a fraction of the health insurance premium over the same time with the average total cost added as the horizontal dashed line.
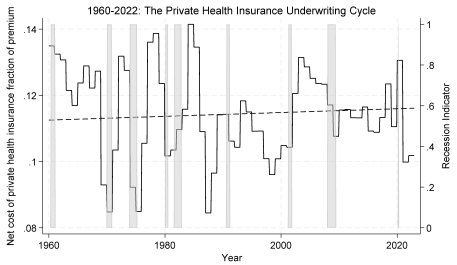
Figure 2. The underwriting cycle is defined by the net cost of private health insurance expressed as a fraction of premium revenue (solid black line) and is shown against the average total cost (dashed black line). This graph is a magnified version of the right panel of Figure 1, with National Bureau of Economic Research recessions shaded in gray and the date formatted in month and year rather than just year to match the recession indicator format.
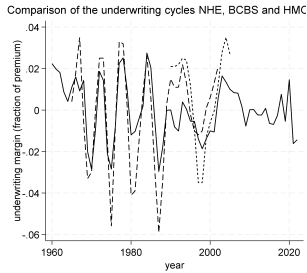
Figure 3. The underwriting cycle based on NHE reported data (solid line), estimated in this paper, the BlueCross BlueShield (medium dashed), and HMO (small dash) series, both reported by the American Hospital Association. The underwriting cycle is the underwriting profit margin time series: 1) the estimated series is reported for 1960-2022; 2) the BCBS series is reported for 1965-2002; 3) the HMO series is reported for 1990-2005.
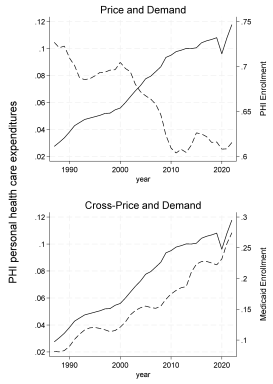
Figure 4. 1987-2022: Graphic analysis of the price (upper panel) and cross-price (lower panel) relation with demand. The price and cross-price are personal health expenditures per enrollee/real personal income per capita for that year on the left vertical axis for both upper and lower panels (solid black lines). Demand is private health insurance enrollment/population for the upper panel and Medicaid enrollment/population for the lower panel (dashed black lines). The regression results and elasticities confirm these graphical observations.
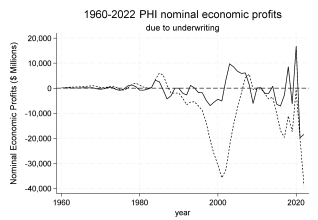
Figure 5. The history of industry-wide PHI economic profits reflects that profitability is unlikely. Neither profits by year (solid) nor cumulative profits (short dash) due to underwriting alone are persistent.